


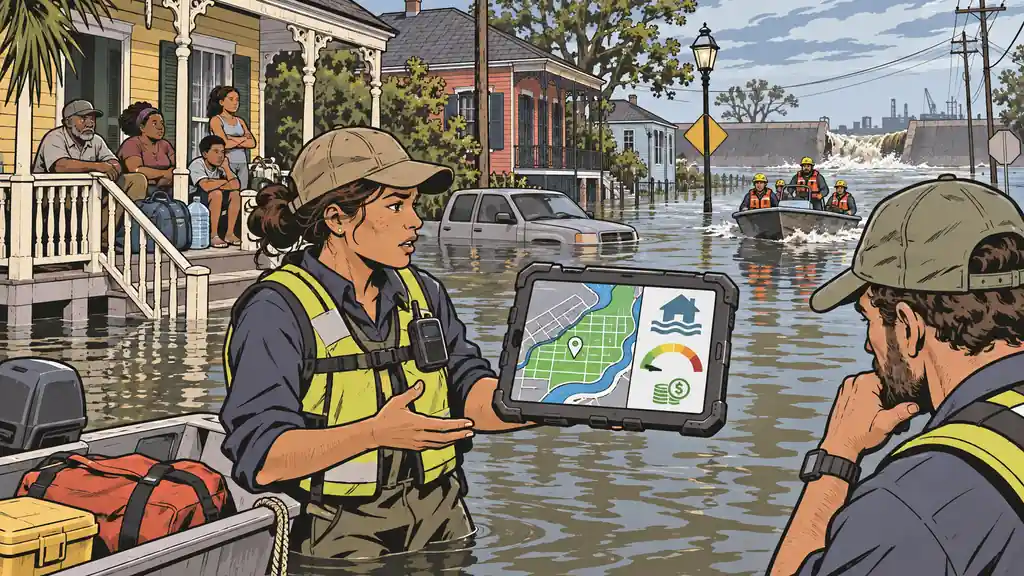
Pull up FEMA’s National Risk Index and look up Orleans Parish, Louisiana — the parish that is New Orleans. For riverine flooding, it sits at roughly the 0.1 percentile. Not the 1st percentile. The tenth of the first. FEMA’s own data rates the flood risk there as lower than in 99.9% of the counties and parishes in the United States.
This is the city where, in 2005, levee and floodwall failures put roughly 80% of the city underwater and Katrina killed more than 1,800 people along the Gulf Coast. A place whose name is a global synonym for catastrophic flooding. And the most-cited free risk tool in America rates it as close to the safest ground in the country for exactly that hazard.
I used to point people at the NRI as a starting place. I don’t anymore, and the Orleans Parish flood score is the cleanest example of why. The number isn’t a bug. It’s the method doing precisely what it was designed to do — which happens to be a different thing than what you and I need it to do.
What the National Risk Index actually measures
The NRI’s headline per-hazard number is built on Expected Annual Loss — the average dollars a hazard is expected to destroy in a given place each year. That loss estimate is then combined with a community’s social vulnerability and its resilience to produce the risk rating.
Read that again, because the whole problem is hiding in it. The core input is expected dollar loss per year. It is an actuarial, insurance-shaped question: on an average year, how much insured and insurable value will this hazard wash away here?
That is a completely legitimate question. It’s the right question if you’re a reinsurer pricing a book of policies, or a federal agency deciding where mitigation grants buy the most reduction in national losses. It is simply not the same question a household is asking, which is: can my family be flooded out, displaced, or killed where I live?
Expected Annual Loss answers “how many dollars will wash away in a normal year.” You are asking “can my home go underwater in a bad one.” Those are different questions, and the gap between them is where New Orleans falls through.
Why a drowned city scores as dry
Once you see the NRI as a dollar-loss model, the Orleans Parish flood score stops being absurd and becomes almost inevitable.
The index splits flooding into separate hazards — riverine (rivers and streams overtopping their banks) and coastal (surge and tidal flooding). New Orleans’ signature disaster wasn’t a river jumping its banks; it was storm surge driving through failed levees into a bowl that sits below sea level. So the riverine model — the one scoring 0.1 — is being asked about a failure mode that isn’t the one that nearly ended the city. That’s a point in FEMA’s favor, and I want to be fair about it.
But the charitable reading doesn’t save the tool, because the NRI’s coastal flooding score for the same parish lands around the 5th percentile — still near the bottom of the entire country. Both of NRI’s flood lenses, pointed at the most famously flooded city in America, read “almost nothing to see here.”
An expected-loss model does that for structural reasons. It leans on historic loss ratios and flood-zone assumptions that treat an area behind an engineered levee as protected, and it’s calibrated to typical-year dollars rather than the rare, correlated catastrophe that defines a place like this. The event that actually matters for a household — the once-in-a-generation failure that puts you on your roof — is precisely the event an average-dollars model is worst at seeing.
What we do differently, and why
Once I realized what the NRI model truly was, I set out to find something better. Unfortunately, it doesn’t exist. As a result, I compiled as much data as possible, and built my own model. In my model, Orleans Parish riverine flooding comes out around the 94th percentile — not the 0.1. The difference isn’t better data; FEMA’s underlying hazard data is excellent. The difference is the question. My model is built to rank whether a large population lives on ground that has demonstrably flooded and can flood again — human exposure to the hazard — rather than the expected annual dollar loss net of levees and resilience scoring. Ask “do people live in a proven floodplain here,” and New Orleans answers loudly.
Neither number is lying. They’re answers to different questions. The NRI’s 0.1 is an honest statement about expected annual insured losses under its assumptions. My 94 is an honest statement about human flood exposure. You just have to know which question you’re holding when you read the number — and for preparedness, mine is the best one.
The trap this sets for ordinary people
Here’s why this matters beyond one parish. The NRI is free, official, and genuinely good at its job, so it has been quietly absorbed into tools people use to make life decisions — relocation and “is this town safe” sites, real-estate risk scores, and planning dashboards that surface a single reassuring color. A family deciding where to move, or whether to prepare, can land on a number that was engineered to answer a reinsurer’s question and read it as an answer to theirs.
The failure is almost never a wrong number. It’s a category error — using a dollar-loss expectation as a life-and-displacement forecast. The two diverge most violently exactly where it matters most: the rare, high-consequence, correlated disasters that a loss-average smooths into invisibility.
So treat any single risk score — mine included — as a claim with a question attached, and make yourself ask what that question is before you trust the color. For a hazard that could put your household out of its home, you want a model built to count households in harm’s way, not dollars lost in an average year.
Bottom Line
- The NRI measures expected dollar loss, not human danger. Its per-hazard scores are built on Expected Annual Loss — an actuarial, insurance-shaped estimate — then adjusted for vulnerability and resilience. That’s a real and useful question, just not the household’s question.
- Orleans Parish is the proof. FEMA’s riverine-flood score for New Orleans sits near the 0.1 percentile — safer than 99.9% of the country — and its coastal-flood score near the 5th, in the city where 2005 levee failures flooded roughly 80% of the ground and Katrina killed more than 1,800 along the coast.
- It’s a category error, not a glitch. A dollar-loss average is worst at seeing the rare, correlated catastrophe that actually displaces or kills people — which is the exact event you prepare for.
- Know the question behind the score. Before you trust any risk rating for a life decision, ask what it was built to answer. For “can my family be flooded out here,” use a model that counts people in harm’s way, not insured dollars at risk.
See what’s actually likely where you live with the Threat Report, and read the hazard honestly on the flooding threat page.